
Document Indexing
RHET 7340 Topics in Technical Writing

Fig. 1. Front cover from Turn Down the Heat: Why a 4°C Warmer World Must Be Avoided, 2012
The Course
RHET 7340 Topics in Technical, Business, and Government Writing: Indexing is a course taught in the Department of Rhetoric and Writing at the University of Arkansas at Little Rock that provides advanced study of theoretical, practical, or pedagogical topics related to technical communication, in this case document indexing.
Call to Adventure
Since my focus during my master’s program was digital publishing, I felt RHET 7340 Topics in Technical, Business, and Government Writing: Indexing was necessary for building skills in that area. In this course I learned how to create indices based on audience analysis that utilize careful keyword selection, effective cross-referencing, and methodical arrangement.
As an accelerated 5-week summer course, we completed a total of five indices of increasing difficulty and an indexing presentation. For each assignment, we were given a choice of articles to index. We were asked to identify the various audience types for each article and formulate a series of questions these audiences were attempting to solve by reading this particular document. For the final indexing assignment, I created an index for Turn Down the Heat: Why a 4°C Warmer World Must Be Avoided, a report prepared by the Potsdam Institute for Climate Impact Research and Climate Analytics that looks at the risks of a world 4°C warmer. I chose this text to index because I found the subject matter interesting, I am comfortable working with and understanding scientific documentation, and I liked the design of the report as a whole.
Cue the Montage
Audience Analysis
There were two major audiences I had in mind while I was creating this index. The first group consists of researchers and scientists in the fields of climatology, meteorology, earth science, and related fields. Due to the sophistication of the language in the document, it would be a good resource for people in similar fields working on scholarly writing or research. The second group consists of policy makers for government agencies, corporations, and/or special interest groups dealing with agriculture, energy, and sustainability efforts. The authors of the report discuss global climate policies and encourage these groups to take action.
While the document is very scientific, the writing is accessible to the average layman. If the goal of the report is to persuade law and policy makers, then the selective use of scientific language and/or jargon definitely aided in that effort. It was easy to understand, but with enough scientific data and language to feel urgent.

Fig. 2. Executive Summary from Turn Down the Heat: Why a 4°C Warmer World Must Be Avoided, 2012
Index Depth and Process
In order to accommodate the needs of my selected audiences, I felt a deep index would be most appropriate. This meant I would need to average around ten words per page (the completed index averaged eight words per page). I was also mindful of the graphs and charts used in the text and tried to include at least one page reference for each one.
Normally, I begin my indexing process by reading through the text and highlighting, or otherwise recording, all of the important keywords and concepts. For the most part, I try to limit this first reading to the major concepts and keywords. With this particular index, I went through the entire document first before actually recording any terms. On the second read through of the report, I began recording the major topics and keywords in a spreadsheet (Fig. 3). I started using Numbers for Mac on my second indexing assignment and it seemed to help me keep topics, sub-topics, and terms organized and alphabetized.

Fig. 3. indexing spreadsheet used to record major topics and keywords
As I began recording entries, I very quickly realized the method I developed for previous assignments would not be sufficient for capturing data with this level of complexity. This forced me to revise my process and create a new spreadsheet keep things organized. That new spreadsheet included more columns to address the added complexity: categories, topics, sub-entry 1, sub-entry 2, page numbers, see, see also, and notes.
The categories column was used for sorting purposes only. I found that all of the terms within a particular category needed to have an identifier that was separate from the topic column. The reason for this was so the contents could easily be copied into a word processing program (i.e. Microsoft Word) as a table and then converted into plain text. The index entries have very little formatting so that when the table is converted, I won’t have much to do when it comes to cleaning up the entries from my spreadsheet. I also include special characters (≠) to indicate where I will place indentions or line breaks. This way, I can do a few operations with the find/replace function and my index is ready to go.
In order to keep my spreadsheet formatting as clean as possible, I could not clutter the topics column with repeats of the same word. This meant that the sub-entries for that topic didn’t have a main entry (because their technical header is the special character) and therefore would be sorted by ≠ instead of the topic keyword. That was where the categories column became necessary because I would first sort by the category, then the topic, followed by sub-entry 1, sub-entry 2, and the page numbers (Fig. 3).

Fig. 3. Numbers for Mac spreadsheet showing index oranization
During my second read-through, I went through the report page-by-page and record at least one instance of each keyword. I also added any related words that came to mind in the notes section, as well as images or graphs that appeared on the page. Once I entered all of the words for a particular page, I added the page number and move on to the next page.
With the other indexing assignments, this method seemed to work well because I was only working with a maximum of ten pages. The process proved to be very cumbersome with this report because when I finished the second pass and sorted the keywords, I had almost 3000 entries, many of which were repeats of the same 100 or so terms. It was also difficult keeping track of all of the page numbers, even though they were in order (Fig. 4).
After all of the terms were recorded in the spreadsheet and sorted, I began the third phase which was going through and condensing down the topics into a manageable format (see “Africa” entry in Fig. 4). This was the longest part of the process because this is where all the grouping and culling of keywords and topics occurred. This was exacerbated by the fact I still had not solidified how to handle the vastness of the keywords and their organization.

Fig. 4. Indexing spreadsheet with unformatted page numbers
The fourth phase of the process was double-checking that the entries’ page numbers, see, and see also were correct. This stage was almost as time consuming as the third stage. Fortunately, Turn Down the Heat is an Adobe Acrobat file which allowed me to use the search features to quickly cross-check the numbers I recorded against those that came up using the search.
However, this became confusing in some cases where I associated a topic with a different term in the text. For example, I combined wind and ocean currents, which are terms that must be searched for separately in the document.
The fifth phase was simple clean up like adding commas at the ends of words with numbers, periods after words with a see reference, etc. While this was one of the easiest stages in the process, it was also one of the most crucial. The clean up that happened during this stage would determine how easily the spreadsheet would format in the next stage.
The final stage was formatting the index. First, I copied the topics, sub-entry 1, sub-entry 2, page numbers, see, and see also columns into a Word document. From there, I selected the entire table and applied a default font family and size in order to fix any weird formatting that may have been pasted into the spreadsheet. I then converted the table to text, using a space as the column separator (Fig. 5).

Fig. 5. Unformatted Index Copied into Notepad
At this point, I moved all of the text to Notepad and replaced my special characters with line breaks or em spaces. This produced a fully formatted, if extremely plain, index which I imported into Indesign for the finishing touches (Fig. 6). This final stage was the most effortless of the six stages because the computer is doing most the work at this point, thanks to the formatting from the previous stages.

Fig. 6. Formatted index in Notepad without style formatting
Indexing Style
Taking a cue from The Art of Indexing by Larry D. Bonura, I wanted to my index’s style to that of the original document, specifically in regard to the page headers, sub-section headers, and body fonts. According to the Acrobat file, the page headers are Helvetica Light, page titles are Helvetica, page section titles are Helvetica Bold, the pagination is Helvetica Neue Condensed, and the body text was Slimbach Standard-Book. I ended up using Times New Roman for the body text because Slimbach did not have a bold or italic format and I needed that for the illustrations and graphs. I decided on a four column layout with an 8-point font size in order to reduce the page below 10% of the total document length; with this layout, the index would take up roughly 5% of the report’s real-estate. I tried to make my index look like an extension of the original report by using the same colors and page elements as well (Fig. 7).
For my alphabetization, I decided to go with a letter-by-letter approach instead of alphabetizing word-by-word. This just seemed more natural to me and the way I have always used indices. When it came to formatting the entries, I looked at a few indexes from books I had around my house for ideas. The ones I liked best used a comma to separate the locators from the topic (instead of an em space), used an em space to indent subtopics and see also references, placed the see reference at the end of the page references, and placed the see also references below the main heading (or reference heading). This format seemed the cleanest and easiest to read because the reader did not have to visually “dig” around in the text to find information.
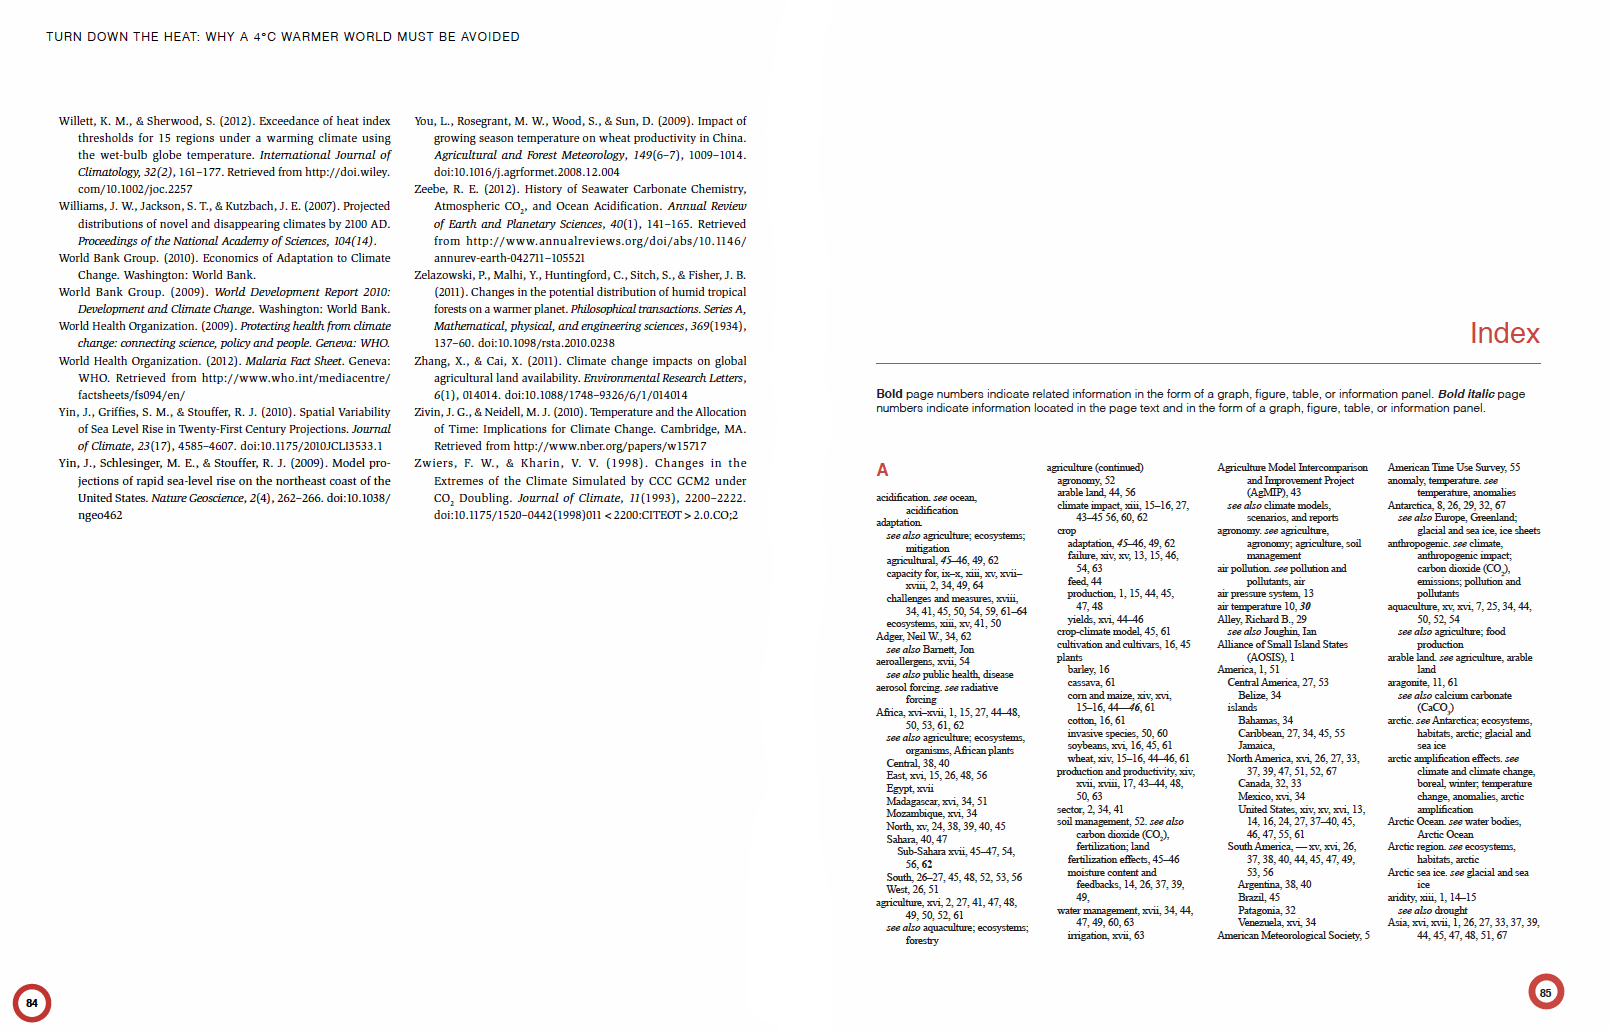
Fig. 7. Style comparison between Turn Down the Heat report (right) and index (Left)
Indexing Challenges
Probably the biggest challenge I faced with this assignment (and others) was time management. More often than not, I would either underestimate the time it would take to complete a step or I would try to do too many processes at once. I was reminded of something a teacher told me in one of my art classes. When drawing a figure, you need to build on your rough sketches. If you spend your time just working on an eye, you will have this perfectly drawn eye floating aimlessly and disproportionally among the rest of the figure. Or, more likely, after three hours, all you will have is this perfectly drawn eye!
At several points during this process, I felt like I had a perfectly drawn eye. I really wish I had followed one phase to completion before beginning another phase. Instead, I found myself in this loop between phases three and four where I was double-checking entries that really had not been solidified in the index. There were countless occasions where I would work on a topic and get it through phase four, only to find that three topics later I was having to adjust that previous topic to account for the new information. Essentially, I ended up doing the double-check process twice on some entries, which was an inefficient use of my time.
It was not until the end that I decided I was spending entirely too much time working through each topic that I decided to commit to phase three and get all of the topics done before moving on to phase four.
Part of the reason for this was just the overwhelming nature of the rough index to begin with. There were so many terms that repeated for almost a hundred entries, with maybe five or six additions that actually added to the topic. I knew looking at it that the index would not be 1500 terms by the end, but it was a nightmare to cull through all of the repeating entries. I often thought it would have been easier with software that automatically resolved the duplicate entries.
Something else I had a hard time with was addressing the references to countries, rivers, continents, etc. In the end, I decided to group all of the countries by continent because I thought they might be easier to find or that a person would more likely search for information related to Europe over information related to France. Additionally, since most of the countries were only mentioned once or twice in the text, I didn’t feel they deserved to be a main topic in the index. I also had a difficult time separating mentions of temperature from mentions of climate. I tried to find a good balance for these kinds of terms (Fig. 8).
For the more technical topics on climate and weather, I kept the scientific audience in mind. For the more humanistic topics on social systems and how we impact the environment, I kept the policy makers in mind because these are the kinds of topics that pull at people’s heart strings and pockets.

Fig. 8. example of continent and climate index entries
The Reward
I have a greater appreciation for what indexers do after taking this course. It is no easy task, especially for the chronic perfectionist. In a lot of ways, indexing reminded me of programming. It’s almost the same as creating a cascading style sheet in that you are making categorical decisions based on the data you have and what you are trying to achieve.
I think one of the biggest take aways I’ve gotten from this class is just learning that I need to stop focusing on drawing that perfect eye! I think this would have been so much easier if I had run through the processes in their proper order instead of jumping ahead to the fourth stage. I’m learning to get that rough sketch done first and then perfect it.